Drilling direction
Generating lower hemisphere plots using the Drilling Direction tab
The Drilling Direction tab of the Depth Based CMW form is used to generate a lower hemisphere stereographic projection that shows the effect of the drilling direction on the breakout width for the specified depth. A combination of the specified depth, scale values and other visualization options in the Drilling Direction tab are used to generate the plot, which is displayed in a separate view. The two images below demonstrate an example of the relationship between the settings in the Drilling Direction tab and the resulting plot.
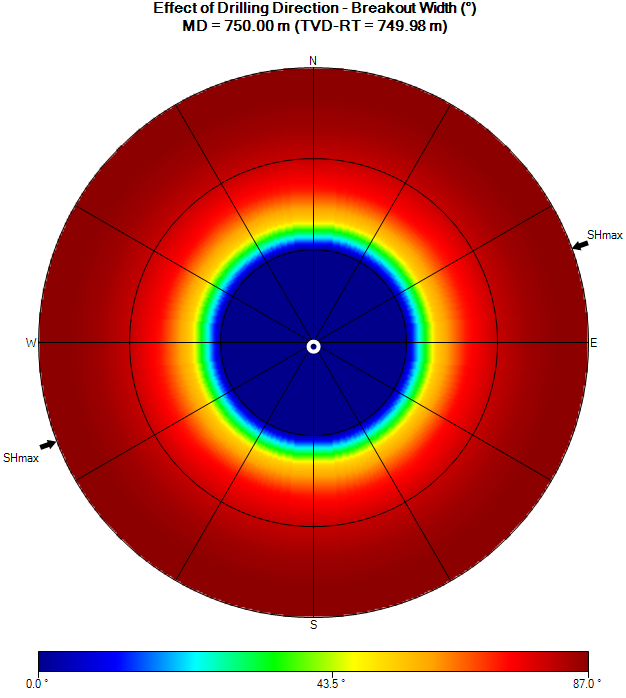
Drilling Direction plot click to enlarge
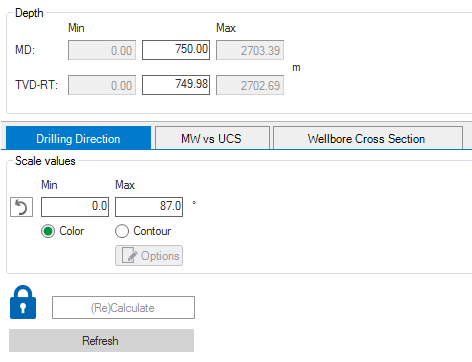
Drilling Direction settings
A basic plot can be produced by specifying depth and scale values, as seen in the image of the plot above. Specifying the depth is a straightforward process, as you simply provide the MD value of interest for the plot. The scale values, however, are initially calculated by the application when a depth is specified to find the best scale range for the given depth. Depending on your needs, the scale values can also be manually defined after the depth is specified.
By default, the different breakout width values are represented by various colors in the plot. This is indicated by the default selection of the Color option, just below the scale values. Instead of colors, you can choose to display the breakout width information using contouring by selecting the Contour option. An additional set of options is available when creating contours.
Contouring options
Select the Contour button, then click Options to open the Contouring options dialog:
Increment The initial increment value is automatically calculated and is the optimal increment for the display of the breakout width values. The increment can still be manually specified, and the original increment value can be restored by clicking the arrow button.
Contour Type
Contour Removes the color fill from the plot and displays only colored contour lines at the specified increment.
Overlay Displays contour lines at the specified increment, but retains the color fill of the plot.
Discrete Color Changes the color fill of the plot from a gradient to discrete colors and uses different colors to fill the increment ranges in the plot.
Show labels Labels the contour lines with the corresponding breakout width values.
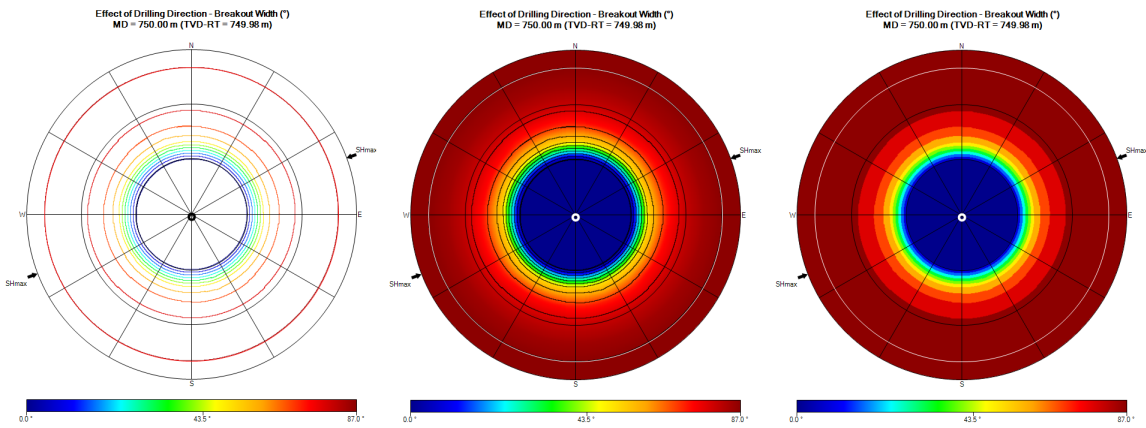
Examples of each of the contouring types, From left to right: Contour, Overlay, and Discrete Color click to enlarge
Creating the plot and the LHP CMW view
After specifying all of the options in the Drilling Direction tab, click (Re)Calculate to generate the plot and Show to open the LHP CMW view, where the plot is displayed.
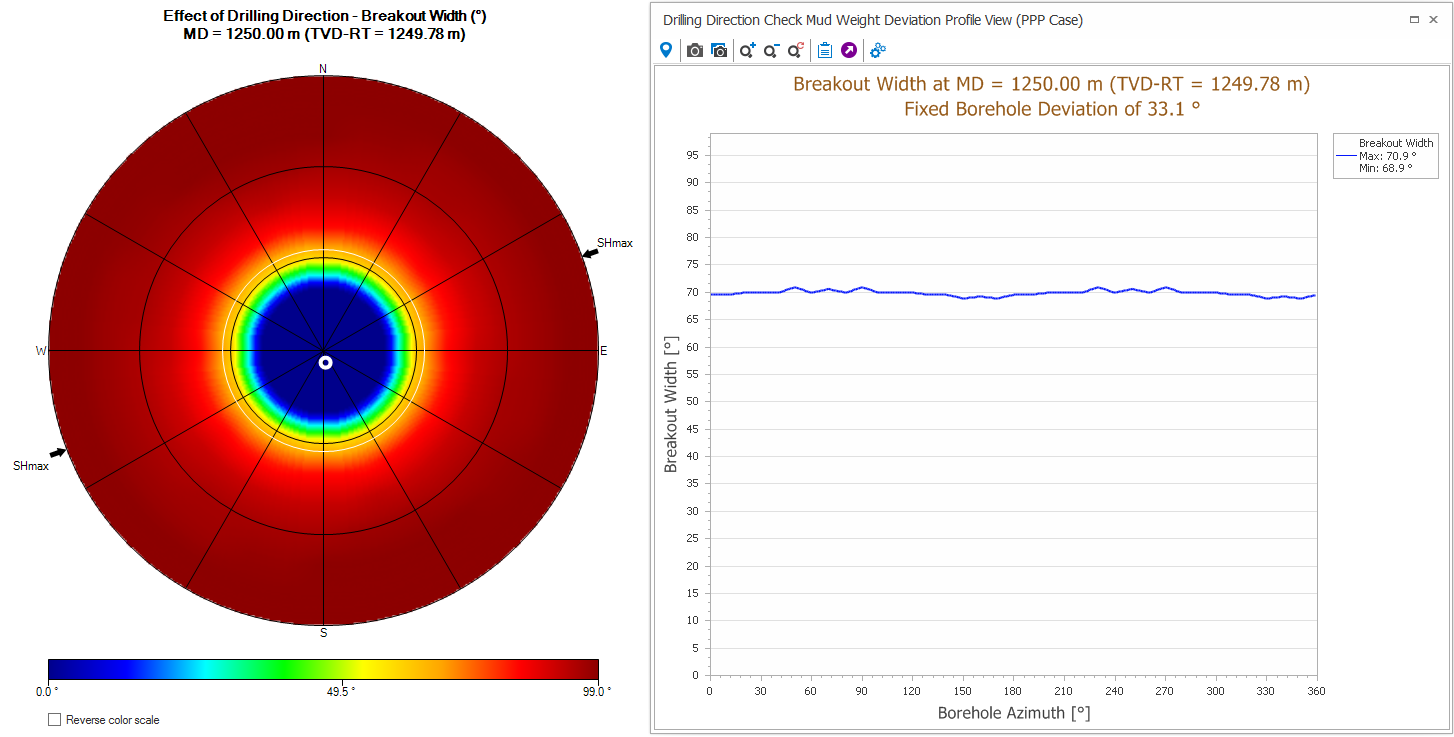
The wellbore position is indicated by a white circle. The white circle for vertical wells is plotted in the center, and horizontal wells plot along the outside edge. The grid in the plot is aligned with the stress symmetry. Geographical north is at top of the plot and the two arrows pointing into the plot indicate the azimuth of the maximum horizontal stress. The colors represent the expected breakout width based on the scale shown below the stereoplot.
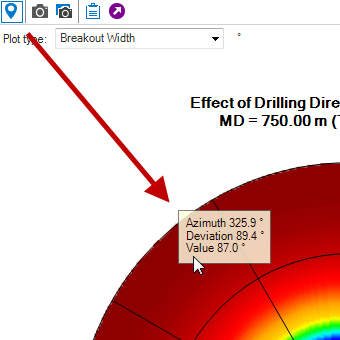
Using the Probe tool click to enlarge
In the plot above, the well, represented by a white circle, is drilled near vertical and, thus, only minor breakouts are expected at this depth. You can get the exact values by using the Probe tool.
Comparing azimuth and breakout width information in the Deviation Profile View
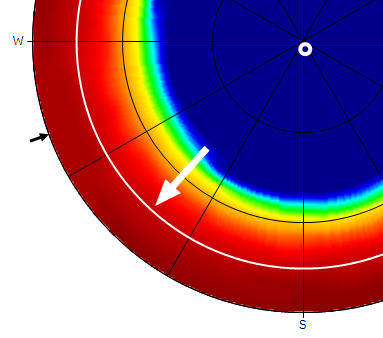
You can observe breakout width versus borehole azimuth values in the Deviation Profile View. This view is opened by clicking any point inside the plot. The resulting view shows the breakout width for any well azimuth at the respective deviation of the selected point. The profile is also indicated and controlled by a white circle within the stereoplot that appears at the location you clicked. When finished observing the information, you can clear the white line from the plot by double-clicking in the blank (white) area of the LHP CMW view.
An example of the CMW Deviation Profile View click to enlarge
While the Deviation Profile view is open, you can drag the white circle to different deviations and update the Deviation Profile view. For fine-tuned adjustment of the circle, you can click the circle itself and scroll the mouse wheel to adjust the position of the circle by a one hundredth of a degree at a time.
click to enlarge
Observing azimuth data for the plot
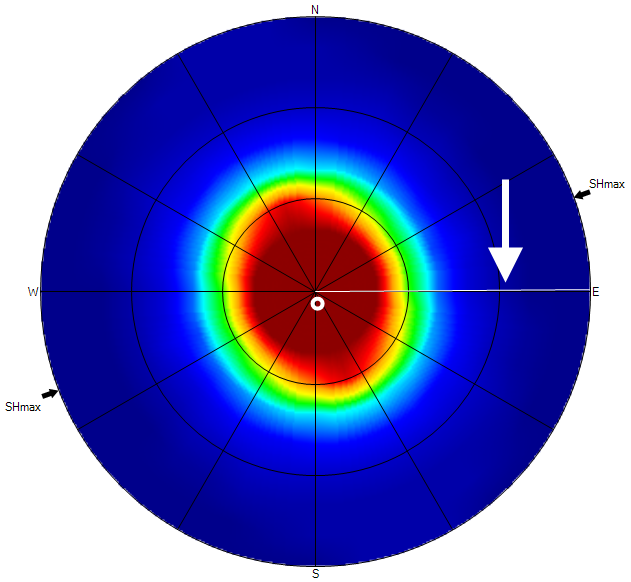
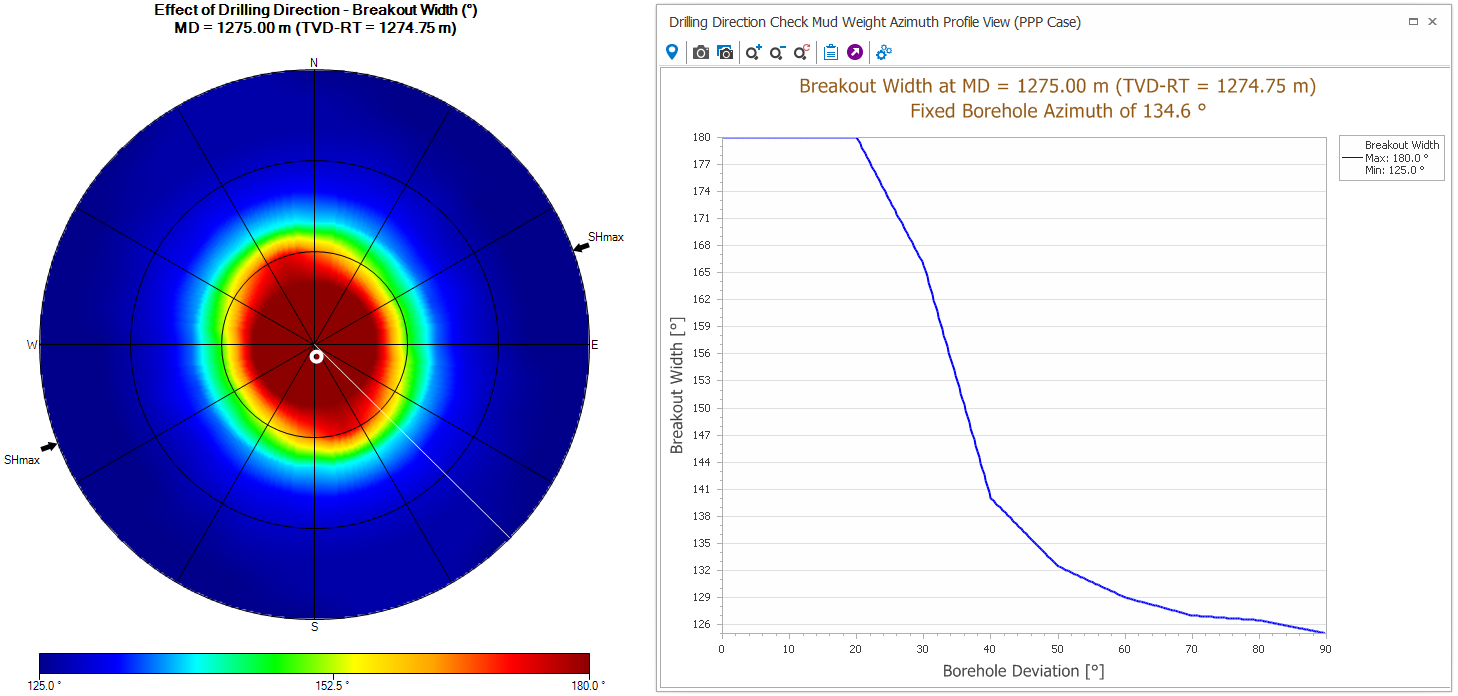
Similarly, you can click any point just outside of the stereoplot, along the azimuth, to open the Azimuth Profile View. The view opens and displays the azimuth profile corresponding to the azimuth value of the location you clicked along the edge of the plot. For example, opening the Azimuth Profile View by clicking near the edge of the plot at geographic east will display the profile view at an azimuth of roughly 90°.
A single click along the edge of the plot will open the Azimuth Profile View click to enlarge
A single click along the edge of the plot will open the Azimuth Profile View click to enlarge
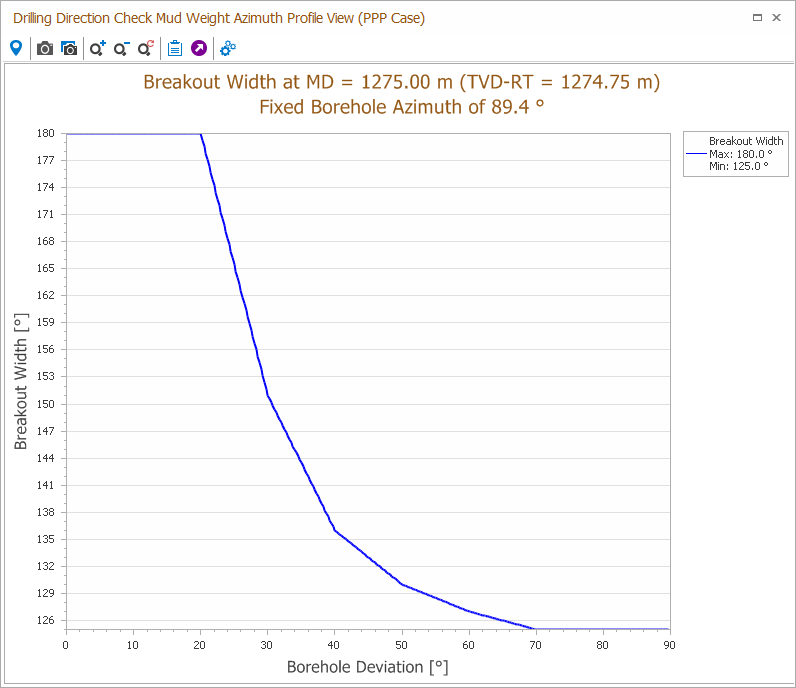
The Azimuth Profile view plots borehole deviation versus breakout width for the selected azimuth. When opening the view a white line appears that extends from the center of the plot to the clicked point along the azimuth. You can drag this line to various positions along the azimuth, with the Azimuth Profile View plot updating automatically. For fine-tuned adjustment of the line, you can click the line itself and scroll the mouse wheel to adjust the position of the line by a one hundredth of a degree at a time.
A single click along the edge of the plot will open the Azimuth Profile View click to enlarge
Exporting data and advanced plotting features using the LHP CMW and Profile View toolbars
LHP CMW toolbar
A toolbar containing copy and export options for the LHP CMW can be found in the top left corner of the view.

|
The probe tool displays object and property info when hovering over the plot. |

|
Copies the view to the clipboard as an image, allowing it to be pasted into external applications. |
|
|
Opens a Save As dialog where you can save the view as an image. |
|
|
Copies the numerical plot data to the clipboard, allowing it to be pasted into external applications. |

|
Exports the numerical plot data to a *.txt. file. |
|
|
Opens a dialog where you can edit the size and font of all text entries in the plot, where you can turn the wellbore position on and off and where you can turn the stress labels on and off. |
Profile views toolbar
The Deviation Profile View and the Azimuth Profile View share the same toolbar. This toolbar contains the same features as the LHP CMW toolbar, but adds zooming options and a settings pane that can be used for fine-grained selection of the profile values.
|
|
The probe tool displays object and property info when hovering over the plot. |
|
|
Copies the view to the clipboard as an image, allowing it to be pasted into external applications. |
|
|
Opens a Save As dialog where you can save the view as an image. |

|
Incrementally zooms in on the plot. |

|
Incrementally zooms out of the plot |
|
|
Zoom rectangle Turns the cursor into a zooming tool. When this option is active, click and drag a box around the data you want to view in better detail. |
|
|
Zoom on both axes Incrementally zooms in equally along both axes. |
|
|
Zoom on the horizontal axis Zooms the view only along the horizontal direction. |
|
|
Zoom on the vertical axis Zooms the view only along the vertical direction. |
|
|
Resets the zoom back to the original level. |
|
|
Copies the numerical plot data to the clipboard, allowing it to be pasted into external applications. |
|
|
Exports the numerical plot data to a *.txt. file. |
|
|
Opens the Profile Settings dialog with the following options: Display Wellbore Position Select the checkbox to show the wellbore position in the profile view. Single Allows you to adjust the profile value using the slider or by typing the value into the text box. Regular/Custom These two options allow you to simultaneously plot profiles for multiple deviation or azimuth values. The Regular option applies the minimum, maximum and increment values to the view and automatically generates the color to value combination for the profiles. This means, for example, that specifying a 5° increment will result in the generation of profiles every 5° over the range specified in the Min and Max text boxes. Note that the values in the Azimuth column are locked when in Regular mode. If you wish to use custom defined increments, select Custom, which unlocks the values in the Azimuth column and allows you to specify the value for each profile you want plotted. |